Why Server-Side Analytics Is Essential for Identifying AI Crawlers

Monitoring how a search system actually moves through my website?

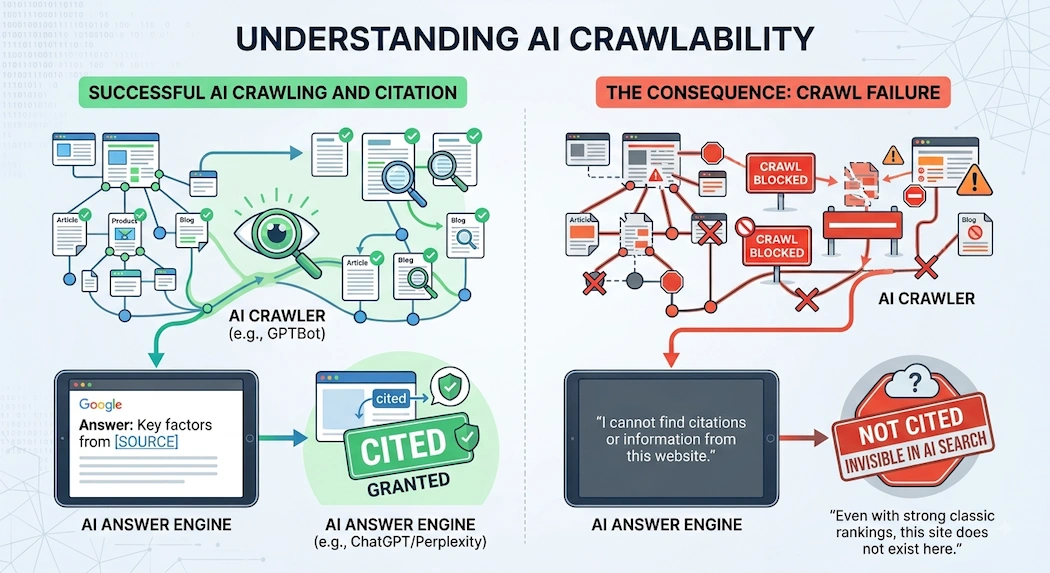
Diagram illustrating AI crawlability: Open access allows AI crawlers to process pages and generate citations, while blocked access prevents answer engines from citing contentAI crawlability is the ability of AI crawlers and answer engines (GPTBot, ClaudeBot, PerplexityBot, Google-Extended and the rest) to find, access, understand and revisit your content. The logic is brutally simple: if an answer engine can’t crawl your page, it can’t cite it. And if it can’t cite you, you don’t exist in AI search, no matter how strong your classic rankings are. Traditional analytics shows the activity. Server-side evidence helps explain the activity.

Google analytics and server-side behavioural analysis Traditional website analytics are designed to make complex traffic understandable. They show us users, countries, sessions, engagement and events. We open a report, see visitors from Singapore, China, the United States or the United Kingdom, and naturally interpret those figures as people visiting the website from those countries. So who are they?

This is our example of a report we have developed to monitor crawlers/bots to the website:


Search System Behaviour Report

How does AI and a search system actually move through my website?

What evidence is there that search systems are developing an understanding of my website?

Most analytics measure visitor activity. System Flow Analysis measures search system behaviour.

Search systems do not build an understanding of a website by reading isolated pages. They construct a probabilistic model by repeatedly moving between connected pages. Every movement reinforces some parts of the website while ignoring others. Over time these transitions determine where attention naturally concentrates and which pages become central to the websites knowledge structure. This report measures those observed movement probabilities to help explain how search systems are building an understanding of your website.


Report date: Wednesday, 12 August 2026


Search System Activity

Google: 0
Bing: 0
SEO tool: 3
AI crawler: 73
Exploit scanner: 31
Unknown: 393

AI Systems Observed

During this reporting period the following identified AI systems requested pages from your website. These requests may originate from AI training crawlers, AI retrieval systems, or AI-assisted user browsing. Repeated requests generally indicate continued reinforcement of your website within that AI ecosystem.

Unknown Traffic

Background Internet Automation (Non-Human) traffic does not imply human visitors. In most cases, it reflects automated infrastructure activity rather than real user behaviour.

  • Cloud provider infrastructure (Amazon, Microsoft, Huawei, Tencent)
  • Automated vulnerability scanners probing websites
  • Rotating proxy and VPN networks
  • Headless browsers and automation frameworks
  • Scrapers that do not identify themselves
  • Legacy bots and monitoring systems
  • Deliberately disguised crawler traffic

Probability Reinforcement Metrics

Authority Flow Metrics

AI Knowledge Footprint

Reporting Period: 14 Jul 2026 – 12 Aug 2026

Measures identified AI crawler requests across valid website pages during the last 30 days, showing the breadth and repetition of observed crawler activity. Learn how repeated AI observations contribute to a website’s evolving knowledge footprint.


Knowledge Stability Analysis

Reporting Period:
14 Jul 2026 – 12 Aug 2026

These pages have been repeatedly revisited by identified AI systems during the last 30 days. This table measures the consistency of reinforcement rather than simply counting visits.

  • Page: identifies the website page visited by recognised AI systems during the reporting period.
  • Days Seen: records the number of separate days on which the page was revisited, indicating the consistency of crawler activity over time.
  • Total Visits: shows the total number of AI crawler requests received by the page.
  • Average / Day: is calculated by dividing Total Visits by Days Seen and represents the average level of AI activity on the days the page was observed.
  • Last Seen: records the most recent date on which the page was visited, providing an indication of whether AI crawler activity remains current.
  • Knowledge Stability Analysis.These pages have been repeatedly revisited by identified AI systems during the last 30 days. This table measures the consistency of reinforcement rather than simply counting visits.

Learn why repeated reinforcement creates stable probability patterns.


Website Search Behaviour Matrix (Cumulative)

This matrix represents the cumulative movement behaviour observed across all recorded search system visits since measurement began. Unlike a daily snapshot, it reflects the long-term structural behaviour of search systems as they repeatedly explore your website. As additional observations are collected, the transition probabilities gradually stabilise, providing an increasingly reliable representation of how search systems navigate, interpret and reinforce your websites knowledge structure. Learn how Markov Chains model search system movement.


Notes:

This analysis estimates the long-run equilibrium of observed search system movement through your website. Higher probabilities indicate areas that naturally attract and retain search system attention after repeated exploration.

The Website Search Behaviour Matrix shows how automated search systems move between different types of pages on the website.

Rather than simply counting how often a page is visited, the matrix records **what happens next**. For example, if a search system visits an Entry Page, does it move into Supporting Content, reach an Authority Core page, visit a Commercial Page, or leave the measured website structure?

Each row represents the type of page the system is currently visiting, while the percentages show where its next recorded movement occurs.

Over time, these observations reveal recurring patterns in how the website is explored.

The strongest pattern in the current results is the importance of **Supporting Content**. Once search systems enter this part of the website, 91.83% of subsequent movements remain within Supporting Content. Supporting Content also receives substantial movement from Entry Pages, High-Value Pages, Structural Pages, Commercial Pages and the Authority Core.

The **Authority Core** shows its own strong persistence, with 62.18% of movements remaining within Authority Core pages. At the same time, 26.89% move from the Authority Core into Supporting Content, indicating a measurable relationship between the website’s central authoritative material and the wider information supporting it.

The matrix therefore provides a behavioural map of the website. It does not prove what a search engine has learned or how it will rank individual pages. What it does demonstrate is **which parts of the website automated systems repeatedly visit, how they move between them, and where persistent structural relationships are emerging over time**.

As more observations are collected, these probabilities can be compared over time to determine whether those movement patterns are strengthening, weakening or changing.

Learn how probability influences search visibility over time.

Search System Equilibrium

 

Structural Interpretation

These observations are derived from the transition probabilities and equilibrium model shown above. They describe how search systems are currently interpreting and reinforcing the structure of your website based on observed navigation behaviour.
  • Established Authority Core Retention. Search systems are retaining a substantial proportion of movement within the Authority Core once it is reached, indicating established internal reinforcement between the principal knowledge pages.

  • Limited Authority Core Discovery. Relatively little observed movement progresses directly from Entry Pages into the Authority Core, indicating that the principal knowledge structure is not being strongly discovered from the website’s entry layer.

  • Supporting Content Dominance. Supporting Content accounts for a substantial proportion of estimated long-run search system attention and strongly retains movement within its own content layer. Relatively little movement progresses from Supporting Content into the Authority Core, indicating that search system attention is being concentrated within supporting material rather than transferred towards the principal knowledge structure.

  • Limited Authority Core Concentration. The Authority Core currently represents 6.37% of the estimated long-run search system equilibrium. This indicates that the Authority Core is not yet a dominant destination within the website’s overall movement structure.

What the Results Show

  • The website contains a highly dominant Supporting Content network and a smaller but strongly self-reinforcing Authority Core. The principal structural difference between them is accessibility: Supporting Content attracts movement from across the website, while the Authority Core demonstrates strong persistence primarily after it has already been reached. Taken together, the report shows that automated interaction with the website is not evenly distributed.
  • Supporting Content demonstrates the strongest cumulative internal persistence, while the Authority Core also shows substantial reinforcement once reached. At the same time, the daily Core Capture Rate of 2.64% shows that only a small proportion of the day’s total recorded requests reached Authority Core pages.
  • The AI crawler data provides a second perspective. Identified AI systems are repeatedly accessing multiple pages, with some pages being revisited across numerous separate days rather than receiving only isolated crawler requests.
  • The report therefore measures three related aspects of machine interaction with the website: which systems are present, which pages and structural areas they access, and how recorded activity moves between those areas over time.
  • These results describe observed crawler and system behaviour. Repeated access can demonstrate observation and persistence, but it does not by itself prove that an AI model has learned, retained or incorporated the content into its internal knowledge.

Search System Behaviour Analysis makes the invisible activity of search engines and AI systems visible, revealing what they access, what they revisit, and how they move through the website.

Google analytics and server-side behavioural analysis Traditional website analytics are designed to make complex traffic understandable. They show us users, countries, sessions, engagement and events. We open a report, see visitors from Singapore, China, the United States or the United Kingdom, and naturally interpret those figures as people visiting the website from those countries. So who are they?