

Google analytics and server-side behavioural analysis
When a Website Visitor Is Not a Person
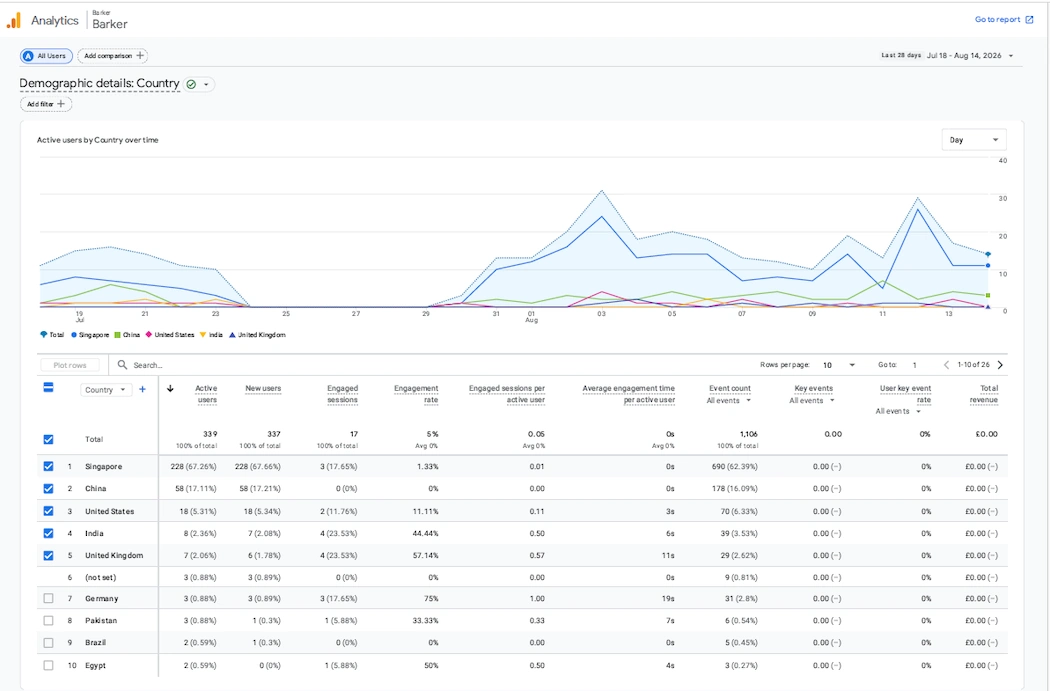
Below is a snapshot of what Google analytics demographics reports for this website.
Most traffic comes from Singapore but who are these visitors?
Why Server-Side Data Changes the Way We Read Traditional Analytics
Traditional website analytics are designed to make complex traffic understandable. They show us users, countries, sessions, engagement and events. We open a report, see visitors from Singapore, China, the United States or the United Kingdom, and naturally interpret those figures as people visiting the website from those countries.
Traditional analytics shows the activity. Server-side evidence helps explain the activity.
But increasingly, that assumption can be wrong.
Traditional analytics can tell us where a request appears to come from. Server-level behavioural analysis can help tell us what actually made the request and what it was doing.
That distinction is becoming increasingly important as automated systems, AI crawlers, cloud infrastructure and search systems account for more website activity.
What Google Analytics Appears to Show
The Google Analytics country report for this website covers the 28-day period from 18 July to 14 August 2026.
At first sight, the results appear straightforward:
| Country | Active users | Engaged sessions | Engagement rate | Average engagement time |
|---|---|---|---|---|
| Singapore | 228 | 3 | 1.33% | 0 seconds |
| China | 58 | 0 | 0% | 0 seconds |
| United States | 18 | 2 | 11.11% | 3 seconds |
| India | 8 | 4 | 44.44% | 6 seconds |
| United Kingdom | 7 | 4 | 57.14% | 11 seconds |
Singapore appears to dominate the website. Of the 339 active users recorded by Google Analytics, 228 were attributed to Singapore. That represents 67.26% of all active users.
Someone looking at the report could reasonably conclude that the website had attracted an unusually large audience from Singapore. The engagement data, however, tells a very different story.
Those 228 Singapore users generated only 3 engaged sessions, producing an engagement rate of just 1.33% and an average engagement time of 0 seconds.
China presents a similar pattern. Google Analytics records 58 active users, yet there were no engaged sessions, a 0% engagement rate and 0 seconds average engagement time.
By comparison, the United Kingdom produced only 7 active users, but 4 engaged sessions, a 57.14% engagement rate and an average engagement time of 11 seconds.
The geographical numbers therefore tell only part of the story.
Now Look at the Traffic From the Server Side
Server-side analysis provides another layer of information.
Traffic attributed geographically to Singapore and China can be examined at network level, including the Autonomous System Number (ASN) associated with the originating IP address.
In this example, server-side observations included:
| Country | ASN | Network organisation |
|---|---|---|
| Singapore | AS16509 | Amazon.com, Inc. |
| Singapore | AS132203 | Tencent Building, Kejizhongyi Avenue |
| China | AS45090 | Shenzhen Tencent Computer Systems Company Limited |
| China | AS4837 | CHINA UNICOM China169 Backbone |
This changes the question completely. Instead of asking:
“Why are so many people in Singapore visiting the website?”
we can begin asking:
“What systems operating through infrastructure in Singapore are making requests to the website?”
That is a fundamentally different question. An IP address geolocated to Singapore does not necessarily represent a person sitting in Singapore reading a webpage. It may represent infrastructure located there through which an automated system is operating.
Likewise, identifying Amazon, Tencent or China Unicom infrastructure does not by itself identify the specific crawler, application or organisation responsible for an individual request. Further evidence — including IP addresses, user agents, request patterns, reverse DNS where applicable, requested URLs and repeated behaviour — is required before making that attribution.
But the server data gives us something that the country report alone cannot: a way to investigate what sits behind the geographical label.
The Difference Is Visible in the Behaviour
The Singapore figures are particularly striking.
228 active users.
Yet only:
3 engaged sessions.
1.33% engagement.
0 seconds average engagement time.
Compare that with the United Kingdom:
7 active users.
4 engaged sessions.
57.14% engagement.
11 seconds average engagement time.
The purpose is not to declare that every Singapore visit is automated and every UK visit is human. The available evidence does not support such a conclusion. The important point is that the two populations behave very differently, and the server-side network information gives us another source of evidence with which to investigate why.
Geography Can Be the Geography of the Infrastructure
This is perhaps the most important lesson.
When analytics reports traffic as coming from Singapore, we naturally think:
Singapore = visitor location.
But in an increasingly machine-driven web, sometimes the more useful interpretation may be:
Singapore = location of the infrastructure making the request.
That infrastructure could be serving many different purposes.
The country remains technically useful information, but its meaning changes once we understand what is behind the IP address.
Traditional Analytics Are Not Wrong
This is not an argument that Google Analytics is inaccurate or no longer useful.
Quite the opposite.
Google Analytics provides an extremely useful view of what happens on a website. The problem occurs when we interpret every metric through the traditional assumption that a “user” necessarily represents a human visitor.
Server-side analysis provides another perspective.
Traditional analytics might tell us:
339 active users visited the website.
Server-side analysis allows us to start asking:
What were those visitors?
Were they people?
Search engine crawlers?
AI systems?
Cloud-hosted automated processes?
Security scanners?
Other automated systems?
And once identified, how did those different systems move through the website?
Two Views of the Same Website
This is why traditional analytics and server-side behavioural analysis should not necessarily be seen as competing technologies.
They answer different questions.
Traditional analytics tells us what happened from the analytics platform’s perspective.
Server-side analysis helps establish what actually reached the server.
Put the two together and a much richer picture begins to emerge.
A spike in traffic from Singapore may suddenly make sense.
A country producing hundreds of “users” but virtually no engagement may deserve investigation rather than celebration.
An apparent increase in visitors may actually represent increased crawler activity.
And repeated requests to particular pages may reveal how search systems and AI systems are exploring and reinforcing particular areas of a website.
The Web Has Changed. Our Interpretation of Analytics Must Change With It.
For many years it was reasonable to look at website analytics and think primarily about people.
That assumption is becoming increasingly difficult to maintain.
Websites are now visited continuously by humans, search engines, AI crawlers, automated agents, cloud services, security systems and many other machine processes.
Traditional analytics still provides an important part of the picture.
But increasingly, understanding website traffic requires knowing not only where a request came from, but what made it and what it did next.
That is the power of server-side behavioural analysis.
Traditional analytics shows the activity. Server-side evidence helps explain the activity.