We Can Now See How AI Systems Track & Move Through a Website

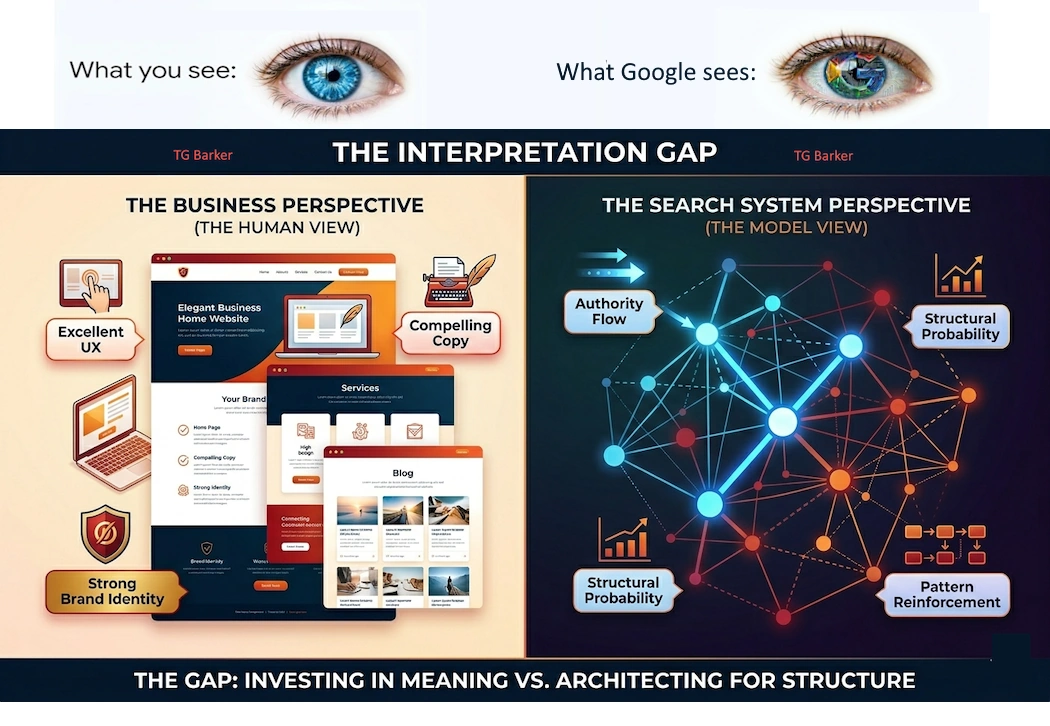
Display of a website example with left hand side giving the human eye view of a user sees with a chart or graph of what a search engine seesIf you own a website, understanding how AI systems travel through it is becoming increasingly important. Yet this is an area that many SEO and analytics platforms have not yet addressed.

Traditional website analytics are primarily designed to measure human visitors — where they arrive, which pages they view and what actions they take. Even Google Analytics is focused largely on human visitor behaviour rather than showing how AI systems and search crawlers move from page to page through a website.

Server-side behavioural analysis provides a different view. By identifying verified search and AI systems and observing their movement through the website, it becomes possible to examine which pages they discover, the paths they follow and which areas of the site they repeatedly encounter.

We asked ourselves:

What evidence is there that AI & search systems are developing an understanding of a website?

Search systems do not build an understanding of a website by reading isolated pages. They construct a probabilistic model by repeatedly moving between connected pages. Every movement reinforces some parts of the website while ignoring others. Over time these transitions determine where attention naturally concentrates and which pages become central to the websites knowledge structure. This report measures those observed movement probabilities to help explain how AI & search systems are building an understanding of a website.

Search System Activity

The report currently monitors and defined by the following:
Google, Bing, SEO tool, AI crawler, Exploit scanner, or Unknown which are all self explanatory however there is always an Unknown figure. Unknown relates to background Internet Automation (Non-Human) traffic which does not imply human visitors. In most cases, it reflects automated infrastructure activity rather than real user behaviour and it categorised by:

Cloud provider infrastructure (Amazon, Microsoft, Huawei, Tencent)
Automated vulnerability scanners probing websites
Rotating proxy and VPN networks
Headless browsers and automation frameworks
Scrapers that do not identify themselves
Legacy bots and monitoring systems
Deliberately disguised crawler traffic

From Yesterday’s Activity to the Longer-Term AI Picture

Within the “Unknown” category are other automated services that scan public websites. Although we are not particularly interested in this activity from a search or AI perspective, it still needs to be identified and accounted for, particularly and as a by product for security reasons. Otherwise, automated activity can become mixed with human visitor data and potentially distort your understanding of what is actually happening on the site.

The report provides another useful layer of visibility. Because activity is recorded server-side, it can show the IP addresses and identified systems that accessed the website, together with the requests they made.

Each daily report provides an audit trail of the previous day’s activity and is delivered by email. This makes it possible to see which recognised search and AI systems visited the site, while also highlighting automated or unidentified activity that may deserve closer examination.

*This tool complements—rather than replaces—standard platforms such as Google Analytics or dedicated network security systems. By recording AI scanning activity and server-side metrics, it adds an additional layer of behavioural insight.*

Unlike conventional visitor reports, the analysis allows you to examine the activity recorded “Yesterday” and then place that activity within a much longer history. AI system movement can be monitored daily and, where appropriate, over monthly periods, while the cumulative record extends from the date a system was first observed on the website.

This provides both views: **what happened yesterday and how that activity fits into the developing pattern over time**. Rather than seeing an isolated snapshot, you can build a historical picture of AI system activity and movement through the website.

Report Features:

1). AI Systems Observed

During this reporting period the following identified AI systems requested pages from your website. These requests may originate from AI training crawlers, AI retrieval systems, or AI-assisted user browsing. Repeated requests generally indicate continued reinforcement of your website within that AI ecosystem.

2). AI Identification Evidence

These are the underlying observations that caused each AI-system identification. This evidence shows what the report observed

3). Probability Reinforcement Metrics

Included are the following, Authority Flow Metrics, Metric Value, Core Capture Rate, Core → Core Transitions, Core Page Hits, Total Visits

4). AI Knowledge Footprint

Reporting Period: Month to Month

Measures identified AI crawler requests across valid website pages during the last 30 days, showing the breadth and repetition of observed crawler activity. Learn how repeated AI observations contribute to a website’s evolving knowledge footprint.
Metrics include:
Identified AI Crawler Requests
Pages Observed by AI Crawlers
Average Reinforcement per Page
Repeated Reinforcement Requests
Change vs Previous Day

5). Top AI Reinforcement Pages

These are the pages most frequently revisited by identified AI crawlers during the reporting period. Learn how repeated AI visits reinforce website understanding. Metrics are Page name and top AI pages total for the period.

6). Knowledge Stability Analysis

Reporting Period: previous month to current month

These pages have been repeatedly revisited by identified AI systems during the last 30 days. This table measures the consistency of reinforcement rather than simply counting visits.

Page: identifies the website page visited by recognised AI systems during the reporting period.

Days Seen: records the number of separate days on which the page was revisited, indicating the consistency of crawler activity over time.

Total Visits: shows the total number of AI crawler requests received by the page.
Average / Day: is calculated by dividing Total Visits by Days Seen and represents the average level of AI activity on the days the page was observed.

Last Seen: records the most recent date on which the page was visited, providing an indication of whether AI crawler activity remains current. Knowledge Stability Analysis.

These pages have been repeatedly revisited by identified AI systems during the last 30 days. This table measures the consistency of reinforcement rather than simply counting visits. Learn why repeated reinforcement creates stable probability patterns.

Metrics:
Page, Days Seen, Total Visits, Average / Day, Date Last Seen

7). Website Movement Strength

This visual shows the strength of observed cumulative search-system transitions across the website. Longer bars represent higher transition probabilities. The complete Markov tables below provide the underlying measurements.
Bar Chart Metrics:
Movement, Probability Strength (from Page A), Probability Strength (to Page B)

Strength scale: Very Weak < 5%  |  Weak 5% to 19.99%  |  Moderate 20% to 39.99%  |  Strong 40% to 74.99%  |  Dominant 75% and above

Summary example:
What This Shows

The strongest and most structurally important movement patterns are summarised below so that the cumulative Markov probabilities can be interpreted without having to read the full matrix.
Dominant B → B Retention — 92.30%

This is the strongest observed self-retention within the website’s structural content layers. Movement originating within this layer has the highest probability of remaining within the same layer.

Evidence: 2,291 observed B → B transitions from 2,482 total transitions originating from B — Evidence Base: Substantial
Strong X → B Movement — 59.09%

This is the strongest observed movement between two different structural content layers in the cumulative transition model.

Evidence: 1,784 observed X → B transitions from 3,019 total transitions originating from X — Evidence Base: Substantial
Strong Authority Core Retention — 50.00%

Once observed movement reaches the Authority Core, this percentage represents the probability that the next observed transition remains within the Authority Core.

Evidence: 106 observed A → A transitions from 212 total transitions originating from A — Evidence Base: Substantial
Very Weak Supporting Content → Authority Core — 1.41%

This measures observed movement from Supporting Content directly into the Authority Core. A low probability indicates that relatively little observed movement is currently progressing directly from supporting material into the principal knowledge structure.

Evidence: 35 observed B → A transitions from 2,482 total transitions originating from B — Evidence Base: Substantial
Very Weak Entry Pages → Authority Core — 1.12%

7). Website Movement Strength

This visual shows the strength of observed cumulative search-system transitions across the website. Longer bars represent higher transition probabilities. The complete Markov tables below provide the underlying measurements.
Bar Chart Metrics:
Movement, Probability Strength (from Page A), Probability Strength (to Page B)

Strength scale: Very Weak < 5%  |  Weak 5% to 19.99%  |  Moderate 20% to 39.99%  |  Strong 40% to 74.99%  |  Dominant 75% and above

Summary example:
What This Shows

The strongest and most structurally important movement patterns are summarised below so that the cumulative Markov probabilities can be interpreted without having to read the full matrix.
Dominant B → B Retention — 92.30%

This is the strongest observed self-retention within the website’s structural content layers. Movement originating within this layer has the highest probability of remaining within the same layer.

Evidence: 2,291 observed B → B transitions from 2,482 total transitions originating from B — Evidence Base: Substantial
Strong X → B Movement — 59.09%

This is the strongest observed movement between two different structural content layers in the cumulative transition model.

Evidence: 1,784 observed X → B transitions from 3,019 total transitions originating from X — Evidence Base: Substantial
Strong Authority Core Retention — 50.00%

Once observed movement reaches the Authority Core, this percentage represents the probability that the next observed transition remains within the Authority Core.

Evidence: 106 observed A → A transitions from 212 total transitions originating from A — Evidence Base: Substantial
Very Weak Supporting Content → Authority Core — 1.41%

This measures observed movement from Supporting Content directly into the Authority Core. A low probability indicates that relatively little observed movement is currently progressing directly from supporting material into the principal knowledge structure.

Evidence: 35 observed B → A transitions from 2,482 total transitions originating from B — Evidence Base: Substantial
Very Weak Entry Pages → Authority Core — 1.12%

8). Supporting Content → Authority Core URL Evidence

This table reconstructs the actual Supporting Content URLs from which observed movement progressed directly into Authority Core URLs.

Historical URL relationships identified under the current structural classification: 70

Unique Supporting Content URLs: 36
Unique Authority Core URLs: 9

Historical URL-level evidence is reconstructed from stored referrer-to-page observations and classified using the website’s current structural model. It therefore provides supporting URL-level evidence and should not be expected to equal the cumulative Markov transition count, which was recorded incrementally under the classification rules in effect at the time.
Metrics: Supporting Content URL, Authority Core URL, Observed, First Seen, Last Seen

9). Supporting Content → Authority Core Transfer

This table measures how frequently observed movement leaving each Supporting Content URL progressed directly into the Authority Core.
Metrics:
Supporting Content URL, Outgoing Observations, To Authority Core, Authority Destinations, Transfer Rate, Evidence

Transfer Rate: the proportion of reconstructed outgoing observations from a Supporting Content URL that progressed directly into an Authority Core URL.

Evidence: describes the number of outgoing observations supporting the calculated percentage. A high transfer rate based on very few observations should therefore be interpreted cautiously.

Verify It

The interpretations above are derived directly from the cumulative transition probabilities recorded during the stated measurement period.

Each reported movement can be checked against the Markov System Flow Probabilities and the Website Search Behaviour Matrix shown immediately below.

Measurement Period: System start – Current Date

10). Markov System Flow Probabilities (Cumulative)

Measurement Period: System start – Current date
Metrics: From, To, Probability, Strength

11). Website Search Behaviour Matrix (Cumulative)

This matrix represents the cumulative movement behaviour observed across all recorded search-system visits since measurement began. Unlike a daily snapshot, it reflects the long-term structural behaviour observed as search systems repeatedly access different areas of the website. As additional observations are collected, the transition probabilities gradually stabilise, providing an increasingly reliable representation of how identified search systems move through and repeatedly access the website’s structural content layers. Learn how Markov Chains model search system movement.

Metrics: From / To
E, Entry Pages, B Supporting Content X, External / Exit H, High-Value Pages S, Structural Pages C, Commercial Pages A, Authority Core F, Future Pages

12). Search System Equilibrium

This analysis estimates the long-run equilibrium of observed search system movement through your website. Higher probabilities indicate areas that naturally attract and retain search system attention after repeated exploration. Learn how probability influences search visibility over time.
Metrics: State Probability

Example: Structural Interpretation

These observations are derived from the transition probabilities and equilibrium model shown above. They describe measurable patterns in how identified search systems move between and repeatedly access the website’s structural content layers. The interpretation below is derived from those observed movement patterns rather than from assumptions about a search system’s internal understanding of the website.

Established Authority Core Retention. Search systems are retaining a substantial proportion of movement within the Authority Core once it is reached, indicating established internal reinforcement between the principal knowledge pages.

Limited Authority Core Discovery. Relatively little observed movement progresses directly from Entry Pages into the Authority Core, indicating that the principal knowledge structure is not being strongly discovered from the website’s entry layer.

Supporting Content Dominance. Supporting Content accounts for a substantial proportion of estimated long-run search system attention and strongly retains movement within its own content layer. Relatively little movement progresses from Supporting Content into the Authority Core, indicating that search system attention is being concentrated within supporting material rather than transferred towards the principal knowledge structure.

Healthy Internal Exploration. Search systems continue exploring beyond your high-value pages, helping redistribute authority across the website.

Limited Authority Core Concentration. The Authority Core currently represents 5.46% of the estimated long-run search system equilibrium. This indicates that the Authority Core is not yet a dominant destination within the website’s overall movement structure.

13). Authority Core Reinforcement

This table identifies the Authority Core pages most frequently reached from another Authority Core page. Repeated movement between these pages indicates that search systems are reinforcing connections within the websites principal knowledge structure.
Metrics: URL, A→A Transitions Received

Changes Since Previous Report
This section highlights changes in Authority Core reinforcement since the previous report.
New Entrants:
URL
URL

14). System Activity Log

What follows are the number of and list of daily visitors to the website by the following metrics.
Metrics: IP address, Type, Country, ASN, AS Name, User Agent, Page

Core Foundational & Systems-Level Analysis:

Google Analytics demographic dataGoogle analytics and server-side behavioural analysis
Why Google Analytics alone cannot identify every website visitor. See how server-side analytics reveals AI crawlers, bots and automated traffic.
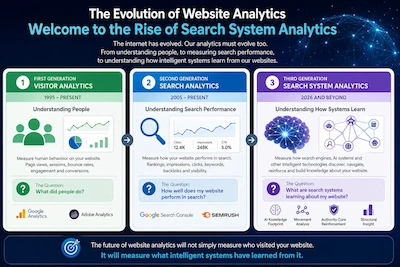
Diagram showing the evolution of website analytics from Visitor Analytics to Search Analytics and finally Search System Analytics, illustrating how intelligent search systems learn from websites.The Rise of Search System Analytics.
The internet has fundamentally changed – For more than two decades, website analytics has revolved around one central objective: understanding people.
Architectural blueprint showing a website structure foundation, illustrating how commercial hub pages, pillar content, and supporting blog posts connect to direct PageRank and authority flowYour Website Needs a Foundation
How PageRank, the Random Surfer model, graph theory and Markov chains can help structure a website around the pages you most want to rank.