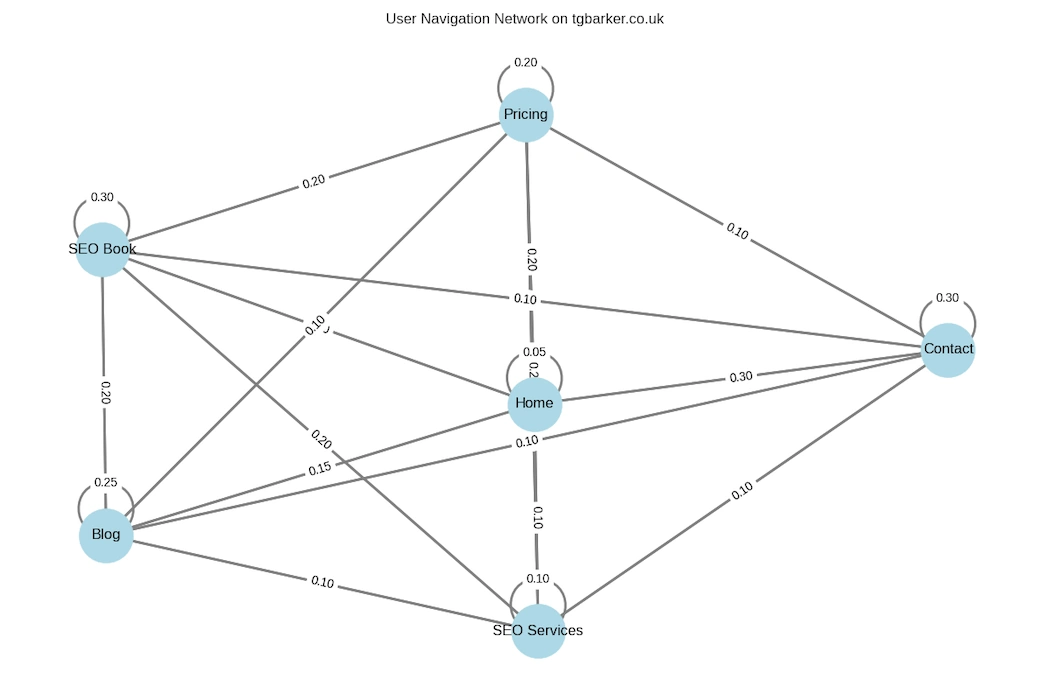
This graph gives you a strategic map of how users interact with your site—perfect for guiding internal linking, CTA placement, and content updates. A Markov chain models user navigation as a stochastic process where the next page visited depends only on the current page—not the full history. This is ideal for estimating transition probabilities across your site.
Google’s original PageRank algorithm, introduced in the late 1990s, was built on Markov modelling principles—treating the web as a graph of interconnected pages where a “random surfer” follows links with certain probabilities. Each step in this Markov chain represented the likelihood of moving from one page to another, and the stationary distribution of this process produced the PageRank score, a measure of authority and importance. While Google has since layered hundreds of other ranking signals on top, PageRank has always remained a core part of their system, continuously refined to handle scale, spam, and modern search needs. Even today, authority flow across links and the underlying Markov chain mathematics still influence how Google evaluates and orders pages in its search results.
While many SEO companies are busy speculating about the complexities of search and AI merging in the future, we take a different approach. Instead of only writing about AI and Search merging, we are practically using AI — to help visualize websites. In this example, we show how AI assists in examining your current site by working alongside Google Analytics to provide clearer insights.
How introducing a new page (like “Case Studies” or “AI Packages”) might redistribute flow:
New Page Simulation: Case Studies & AI Packages
🆕 Expanded Page Set
• Home
• Blog
• Services
• About
• Contact
• Pricing
• Case Studies
• AI Packages
🔁 Updated Transition Matrix (Simplified)
| From / To |
Home |
Blog |
Services |
About |
Contact |
Pricing |
Case Studies |
AI Packages |
| Home |
0.04 |
0.30 |
0.20 |
0.08 |
0.08 |
0.15 |
0.10 |
0.05 |
| Blog |
0.10 |
0.35 |
0.15 |
0.08 |
0.08 |
0.10 |
0.10 |
0.04 |
| Services |
0.08 |
0.20 |
0.20 |
0.08 |
0.08 |
0.15 |
0.15 |
0.06 |
| About |
0.08 |
0.15 |
0.15 |
0.20 |
0.08 |
0.10 |
0.14 |
0.10 |
| Contact |
0.15 |
0.10 |
0.08 |
0.10 |
0.20 |
0.15 |
0.12 |
0.10 |
| Pricing |
0.20 |
0.08 |
0.15 |
0.08 |
0.10 |
0.20 |
0.10 |
0.09 |
| Case Studies |
0.10 |
0.10 |
0.20 |
0.10 |
0.10 |
0.15 |
0.15 |
0.10 |
| AI Packages |
0.08 |
0.08 |
0.18 |
0.10 |
0.10 |
0.20 |
0.16 |
0.10 |
📈 Simulated Steady-State Distribution
| Page |
Long-Term Probability |
| Blog |
22.6% |
| Case Studies |
16.8% |
| Pricing |
15.2% |
| Services |
14.3% |
| AI Packages |
10.7% |
| Home |
8.9% |
| About |
6.3% |
| Contact |
5.2% |
Strategic Insights
🧠 Case Studies = Trust Magnet
• Strong long-term retention suggests users value proof and real-world results.
• Use this page to reinforce credibility and link back to Services and Pricing.
🤖AI Packages = Conversion Catalyst
• High flow from Services and Pricing implies users are exploring solutions.
• Optimize this page for clarity, tiered offerings, and direct CTAs.
🔗Internal Linking Strategy
• Link Blog posts to Case Studies and AI Packages to guide users deeper into the funnel.
• Consider dynamic modules like “Related Solutions” or “Success Stories” on high-traffic pages.


